|
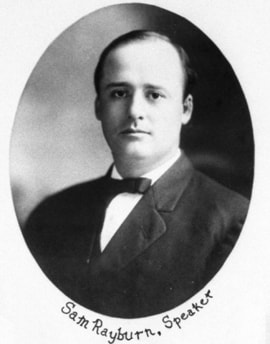
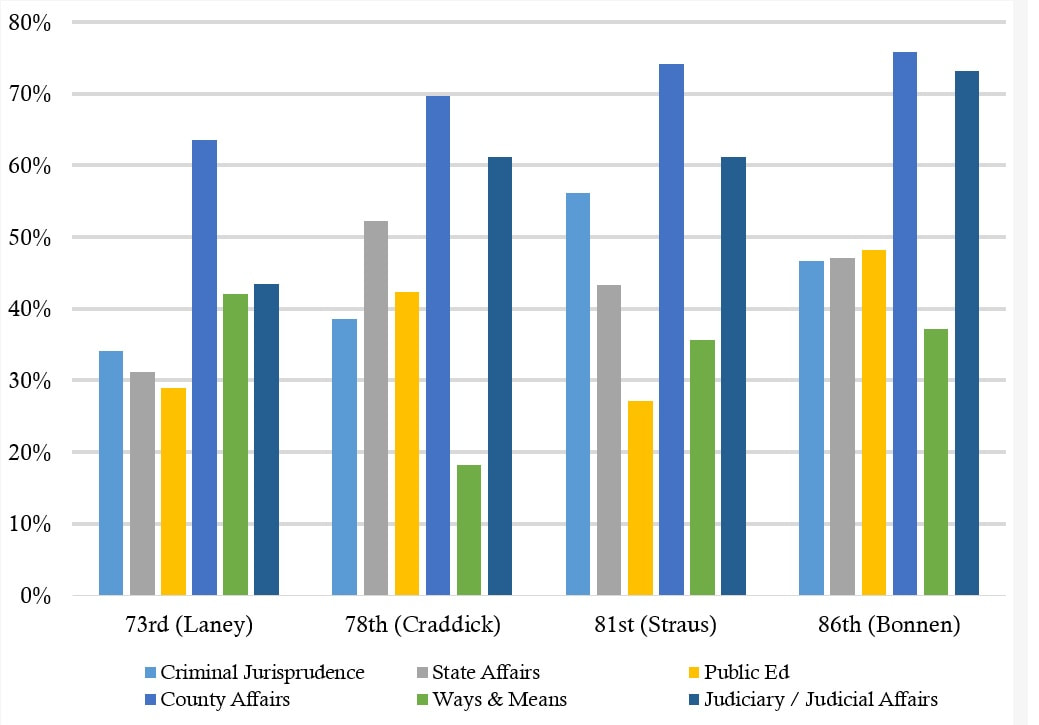
In his first (and only) session as Speaker of the Texas House of Representatives (1911), Sam Rayburn – who would go on to a legendary career as Speaker of the U.S. House – helped create the modern Texas Speaker by using his political position to pass preferred legislation through the emerging committee system. He admitted, however, he “muddled through his first session by God, by desperation, and by ignorance.” * Speaker Dennis Bonnen was elected Speaker of the Texas House 108 years later to lead the 86th legislative session. How does his first year as Speaker compare to other recent Speakers’ first years? The figure below compares the passage rates (total bills referred divided by the bills approved out of committee) of six major committees from the first sessions for the last four new speakers of the Texas House: Pete Laney in the 73rd (1993), Tom Craddick in the 78th (2003), Joe Straus in the 81st (2009), and Dennis Bonnen in the recently passed 86th (2009). Differences in committee passage rates often due to circumstances outside the control of the Speaker. In some sessions the state was so cash poor that Ways and Means was less busy (the 78th). Other sessions used key committees as superhighways for policy changes – like criminal justice reform and public education reform in the 86th. Gridlock governed other sessions so little legislation got passed. For the 73rd session, Texas Monthly summed it up: “When it was bad, it was awful. There were raucous debates over sodomy and handguns, attacks on sex education, and a rodeo war between Mesquite (honored as the Rodeo Capital of Texas) and Pecos (honored for its Oldest Rodeo in the World).” The workhorse committee State Affairs – a favorite proving ground for leadership’s favored legislation – approved more legislation in the 86th session under Bonnen than the 81st under Straus but not as much as the 78th under Craddick. Both County Affairs and the Judiciary or Judicial Affairs Committee (the name changed over time) have had a freer hand since the 73rd with each passing session. The 86th followed this pattern with more than 70% of legislation referred to these committees pass to second reading. Bonnen got high marks for keeping his legendary temper (mostly) in check and letting the members run the show. At least as far as committee legislative approval rates are concerned, committee under Speaker Bonnen had approval rates as high or higher on these key committees than most other first term speakers. Pete Laney, who was replaced as Speaker in 2003 after Democrats lost the majority in the House, advised his “job as speaker was to make the job of each member easier by letting them represent their district.”* The evidence suggests that Speaker Bonnen followed this advice.
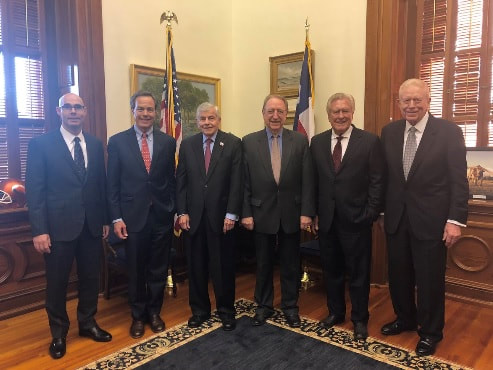
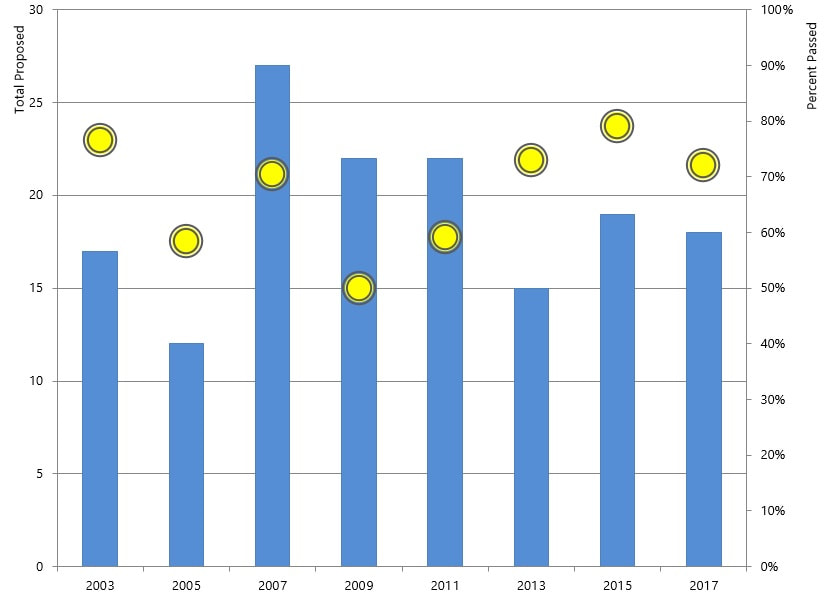
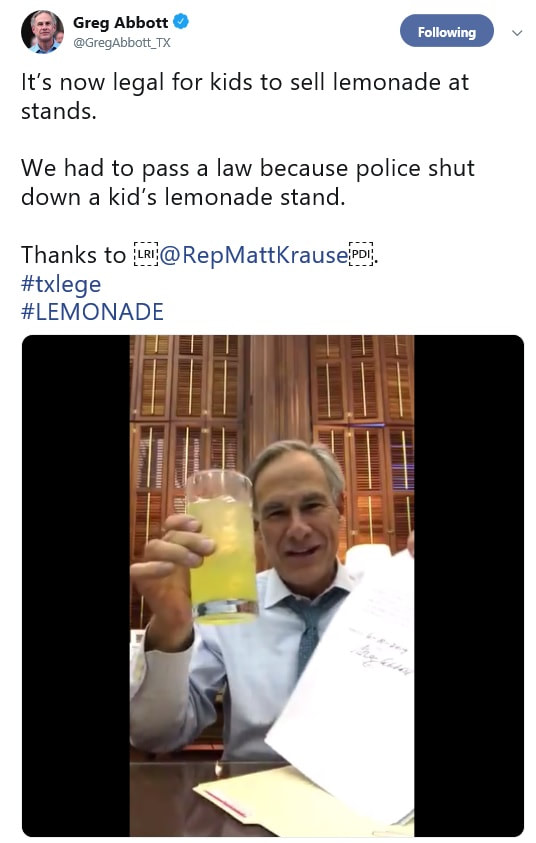
* Source: Patrick L. Cox and Michael Phillips, The House Will Come to Order (2010) At the Governor’s mansion in Austin, the “Big 3” – Governor Abbott, Lieutenant Governor Patrick, and Speaker Bonnen – declared the 86th Legislature a “Superbowl of sessions.” No MVP would be named, they said, but sessions often produce winners and losers. So, how did the Governor do in this big game as compared to past sessions? The analysis in the table below examines the total legislative proposals passed out of the total legislation proposed in the Governor’s 2019 State of the State Address. The results are quite good for Governor Abbott – his success rate was 84%, higher than his previous three sessions (2013-2017). This success rate was also higher than Governor Perry’s last few sessions. The Governor was batting 100% on his emergency items: teacher pay, school finance, property tax caps, rape kit backlogs. Most of these priority items were (more or less) agreed to before the session started but the Governor gets some credit for working the process to get them into law. Most of his other items (like new anti-gang centers, funds to combat human trafficking, and more funding for veterans) also passed. What didn’t pass were smaller agenda items. One request was for an increase in border security funds – the state ponied up their usual spending (about $800 million) but Governor Abbott’s last minute request for an extra $100 million was quickly rejected. Aggies and Longhorns anxious for a gridiron matchup to renew their football rivalry were as disappointed as the Governor that legislation encouraging the annual game didn’t get past the line of scrimmage.
Several large Texas counties (Harris, Bexar, Dallas) are switching to county-wide polling locations citing lower costs and voter convenience. But, do vote centers boost voter turnout? In this comprehensive study we examine the transition to vote centers in Texas across the several election types. (The article is forthcoming at Research & Politics.) BACKGROUND: In 2005, the Texas Legislature approved a program (HB 758) for county-level decision making to move from precinct level voting to “vote centers” for the November 2006 elections. Lubbock County was the first participant the program in 2006, replacing the county’s 69 precincts with 35 vote centers (but kept 8 precincts in rural areas). By 2018, 52 Texas counties used vote centers to conduct constitutional amendment, midterm, or presidential elections. **** TECHNICAL STUFF: To test the impact of vote centers on turnout under distinct elections, we fit a difference-in-difference (DD) fixed effect model with clustered standard errors at the county level. The DD estimator allows us to compare counties before and after the implementation of vote centers by estimating the difference between the observed mean turnout for counties with vote centers and counties with no vote centers before and after a particular implementation year. **** Do vote centers boost turnout? Using a natural experiment in Texas we find vote centers have a small positive impact on constitutional election turnout (about 4%) but no significant effect on turnout in midterm or presidential elections. PAPER HERE:
What about counties using the process for longer – do voters adapt gradually? The cumulative impact of vote centers over a longer period of time does have a small positive effect on turnout in constitutional elections (about 4%). There aren’t any long term positive effects detected for midterm or presidential elections. (this could partly be because adoptions by several counties is a fairly recent trend so the long term effects are not set yet).
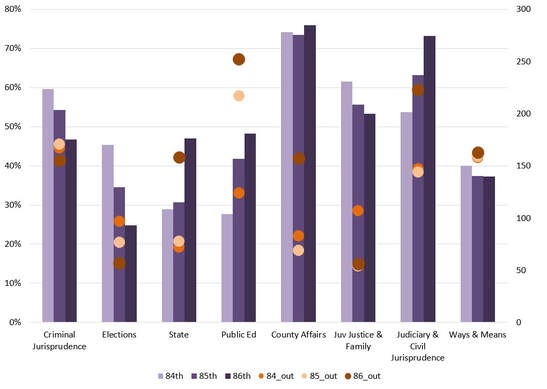
TAKEAWAY : The results from this article show that lower turnout elections (constitutional) benefit from vote centers more than larger turnout elections (midterm/gubernatorial, presidential). The long term effects are slowly emerging. These results suggest a more cautious assessment is needed when considering the use and impact of vote centers. At the end of Speaker Bonnen's first session with the big gavel, consensus is that his even-handed approach gave the members more authority to legislate, especially out of committee. Is this true? One way to examine is to compare the percentage and number of bills voted out of several key committees from the 84th to the 86th sessions. In the above graph, the bars represent the percentage of bills passed out of committee of those referred to the committee and the circles reflect the total number of bills voted out for the 84th, 85th, and 86th sessions.
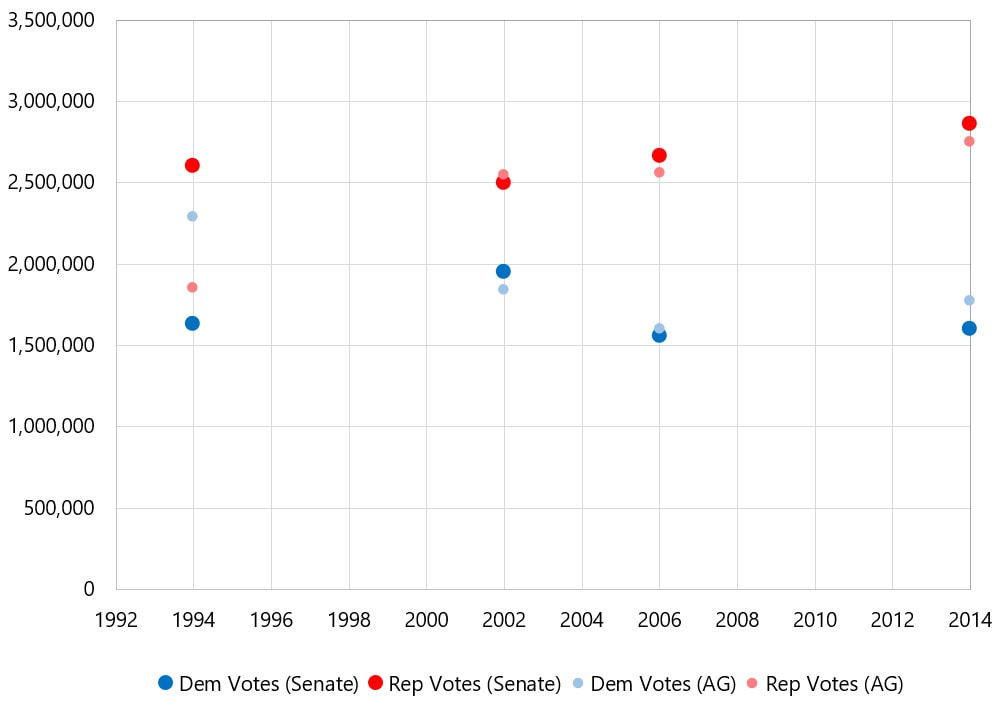
*** One caveat is that there were more committees in the 84th and 85th sessions than the 86th, so the numbers may be artificially higher for some committees. Another caveat is that the total number of bills filed (excluding resolutions) was slightly lower in the 86th (7,324) than the 85th (6,631) and 84th (6,276) for House and Senate bills, providing more opportunities for referrals. *** In some committees, the percentage of bills voted out of committee was up from 84th: State Affairs, Public Education, Judiciary & Civil Jurisprudence. Yet on others (Criminal Jurisprudence, Elections, and Juvenile Justice & Family Issues) the percentage and total bills went down. In County Affairs and Ways & Means, the percentage was more or less the same from the 84th to the 86th. --> The big finding here is the increase in bills out of State Affairs -- the workhorse of the chamber and temporary home to many of the most important bills. Former Speaker Joe Straus drew ire from conservatives for using State Affairs as his personal legislative graveyard. The 86th session seems to have reversed that trend, at least temporarily. It is hard to definitively say that Speaker Bonnen did not have his thumb on the committee scale (or that Speaker Straus did) but the increase in legislation out of key committees made many members happy as their bills got at least more of a puncher's chance to fight another day. The voltage Beto O’Rourke is bringing to the Democratic ticket has Democratic candidates down ballot excited and Republicans worried. But, in a year where many statewide Democrats are underfunded and under noticed, can this electricity at the top of the ticket pull up down ballot Democratic candidates? The causal story is murky, but in the last four election cycles where there has been a Senate election at the top of the ticket in the past 25 years, the down ballot candidate for Attorney General (as a representative “down ballot” race) have actually outperformed the Democratic nominee for Senate. As the figure shows, in most cases, down ballot candidates received more votes than their top of the ticket ballot mates. Dan Morales (running for AG in 1994) took about 650,000 more votes than Richard Fisher (running for Senate). Morales won the seat. In 2014, Sam Houston (not that Sam Houston) took about 200,000 more votes than Democrat Senate candidate David Alameel. The notable exception is Ron Kirk (2002 Democratic Senate nominee) who came out slightly ahead of Kirk Watson, the nominee for Attorney General.
Clearly, the biggest caveat is that none of the past candidates, with the exception of Ron Kirk in 2002, were as well-funded or visible as O’Rourke. Weaker Democratic nominees like Barbara Ann Radnofsky (2006) or David Alameel (2014) weren’t really in a position to help their down ballot colleagues. Party non-binding propositions are like polling Texas on brisket – you’re likely to get a positive response.
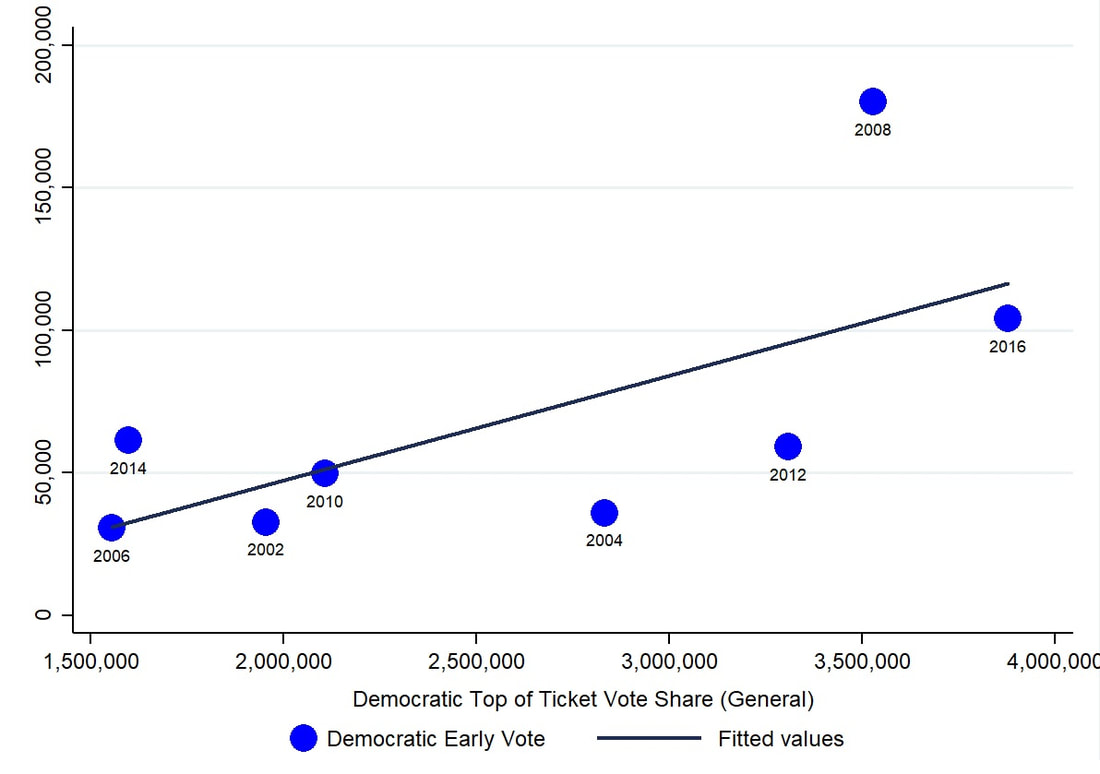
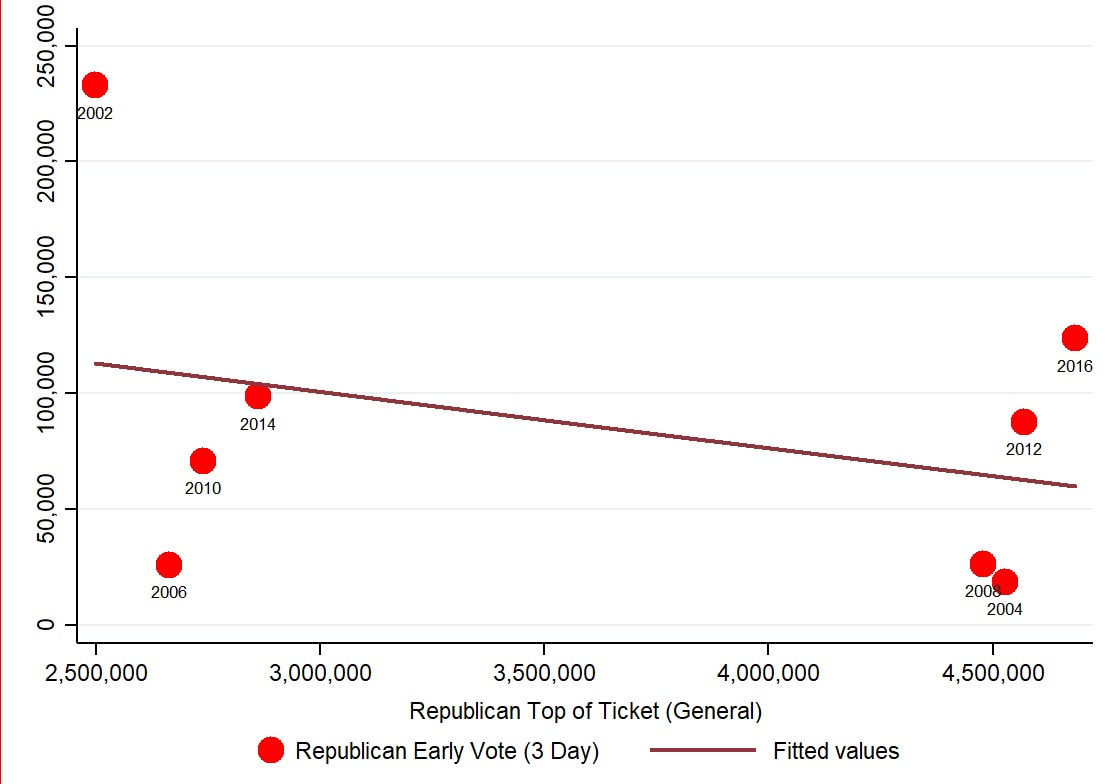
Generally these propositions give guidance to party leaders and legislators about the direction of policy signal the policy preferences of each Party’s most active voters. Reading the tea leaves from these, however, can be difficult. These propositions are complicated and often packed with multiple issues. Consider 2018’s Proposition 5 for the Democrats: Should every eligible Texan have the right to vote, made easier by automatic voter registration, the option to vote by mail, a state election holiday, and no corporate campaign influence, foreign interference, or illegal gerrymandering? Phew. A lot going on there. Plus, these questions appear at the bottom of the ballot, so many voters are facing fatigue after spinning through dozens of state, legislative, local, and judicial races. How did party voters in 2018 respond to these questions? Democrats Democrats consistently voted through the end of the ballot, averaging just over 1 million votes for their 12 ballot propositions, the approximate number who voted in the U.S. Senate race. The lowest response rate was on Proposition 5 to create a national jobs program that found 1,038,433 voters, about 20,000 fewer than average. Of the 12 propositions on the Democratic ballot, most all passed with 95% approval. These included the right to a healthy environment (99%), right to dignity and respect in business and public facilities (97%), the right to health care (95%), and economic security (96%). The lowest vote share was Proposition 8, affirming the right to affordable housing, including high speed internet (92%). Republicans Most Republican voters also made their way all the way to the end of the ballot, averaging about 1.5 million votes (the same number as the primary voters who voted in the Senate race) in each of their 11 ballot propositions. Some propositions found more votes than others: Proposition 3 (electing the Speaker in secret) clocked in at 1,501,248 while Proposition 8 (capping property tax growth to 4%) came in at 1,540,776. Most voters are less aware (or concerned) with the selection of the Speaker, reducing the full vote share by 50,000 but still passing with 85%. Most propositions, by design, pass. This was no different in 2018 on the Republican side: Banning toll roads (90%), requiring employers to screen new hires through E-Verify (90%), protecting the privacy of women and children in bathrooms (90%), and making vote fraud a felony (95%). Despite agreement on most questions, some potentially important differences emerged. Two propositions were lower than the others. Consider Proposition 1 which netted 68% of the vote: Texas should replace the property tax system with an appropriate consumption tax equivalent. The proposition hinted at expanded sales taxes to replace property taxes, but the terminology (“consumption tax”) may have thrown voters off. Although voters dislike property taxes more than any other tax, these taxes may be that the “devil you know is better than the devil you don’t” in the face of economic uncertainty. In either case, fewer Republicans approved. Proposition 5 on education choice also only netted 79% of the vote, significantly lower than the others – it read: Texas families should be empowered to choose from public, private, charter, or homeschool options for their children’s education, using tax credits or exemptions without government constraints or intrusion. Using public education funds for private schools is controversial, even within the Republican caucus. Same goes for tax credits for private schools. Most Republicans support the idea but a significant segment do not. To be sure, these are minor differences and both passed with majority support, but the fact that they aren’t unanimously accepted by Republican primary voters – making them different than the Democrats – suggests some intra-party disagreements on taxes and education spending. The first week of early voting has Democrats abuzz and Republicans sounding the alarm bell. But does the enthusiasm in early voting translate to greater support for candidates in November? After all, November is a long way off and the campaign has just begun. The state’s early primary date also gives even more time for the Republicans’ twin advantages of incumbency and funds raised to expand their margin of victory. Democrats will be happy to learn that there is a relatively high correlation between cumulative three day early voting and vote share of the top of the ticket candidate in the subsequent November election – a .660 correlation overall.* The effect is strongest for senate elections (correlation is .712) and presidential elections (correlation is .624) but relatively strong for gubernatorial elections (.595). he effect for Republican 3 day early voting turnout is mixed but clearly not as strong as for Democrats. Overall, the correlation for top of the ticket vote share is -0.348, posting a negative linear relationship. The strongest results are for presidential elections (correlation is .920) but the weakest are for senate elections (correlation is -0.436.). Gubernatorial elections fall in the middle – early voting in these cycles isn’t as good a harbinger of more Republican votes in November. Democrats have reason to be enthusiastic but not celebratory about the massive jump in early vote turnout. If past trends predict current ones, Democrats can count on an larger vote yields in November. With no presidential race to excite the faithful, Republicans may be looking at smaller margins in November. But, with 10 months to go until Election Day, a lot can happen.
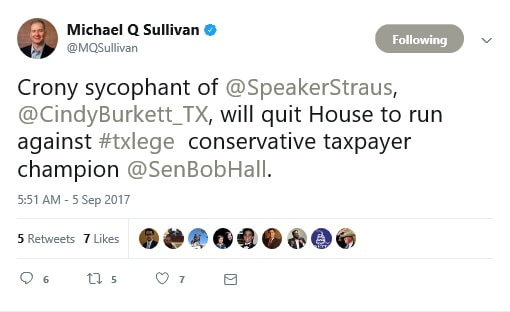
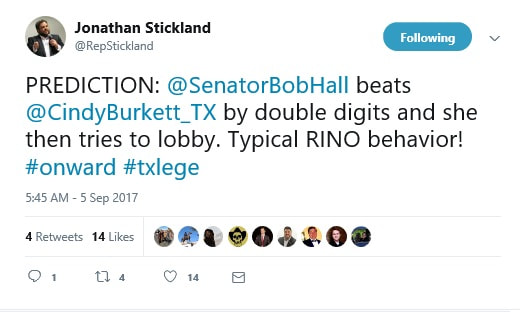
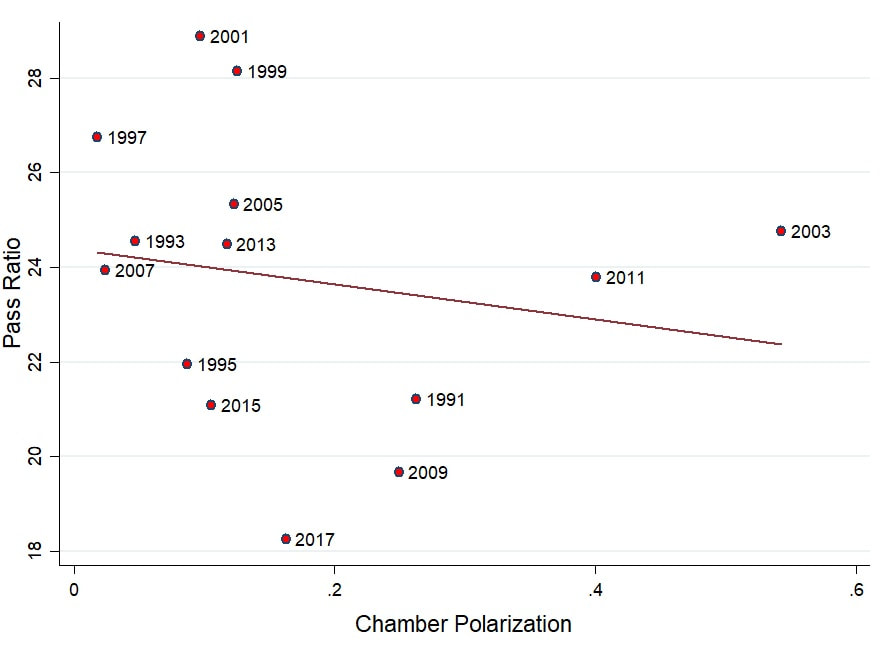
* Correlation coefficient estimates a number from -1 (negative relationship) to +1 (positive relationship) to represent a linear dependence between two numbers. Elections data from Texas Secretary of State, 2002 to 2016. “Top of the ticket” candidate is the race that appears first on the ballot, unless otherwise noted. Primary battles are heating up and there are several intriguing matchups. One to watch will be Senate District 2. House of Representatives member Cindy Burkett (HD 113) announced a challenge to sitting Senator Bob Hall. What do the 2016 results tell us about who might have an edge in SD2? Representative Burkett’s district is made up of fewer conservative voters than SD 2, judged by Republican wins in 2016.* SD 2 is solidly Trump country. Representative Burkett’s district (HD 113) went modestly for Hillary Clinton over Donald Trump (49% to 47%). Senator Hall’s district (SD 2), on the other hand, voted overwhelmingly for Donald Trump (61%) over Hillary Clinton (35%). Notably, voters in SD2 voted for Trump in larger percentages than Texas voters statewide (Trump received 52% statewide). The other statewide official from 2016 with numbers suitable for comparison are Wayne Christian, then a candidate for Railroad Commissioner. Christian received 48% in HD 113 but 60% in SD2. In general, Republican candidates won larger percentages in SD 2 than HD 113, and Republican candidates generally outperformed their district or statewide averages (when there was overlap) in SD 2. The implication, as is so often the case in Republican Primary fights, is that whoever can position themselves as the most conservative will win. Several prominent conservatives have already weighed in on this issue. Turnout will also be key. SD2 is more rural than HD 113, so getting voters mid-sized towns like Bonham, Sulpher Springs, and Terrell, and small towns like Kaufman, Canton, and Crumby out to vote will be critical. * Data from the District Election Reports, Texas Legislative Council, 2016 elections. A Tale of Two Chambers The epic levels of distrust between the Texas House and Senate (exacerbated by personal tension) has shaped many of the state’s legislative sessions, especially the 85th regular session. Chamber differences, however, are as old as the Republic itself. The first Congress of the Republic was tasked with the responsibility to select a site for a permanent capital. Predictably, House and Senate committees failed to agree – the House preferred Nacogdoches and the Senate preferred San Jacinto. A joint vote of both chambers was called and Houston was eventually selected (see note!). Is this friction between the chambers producing less legislation? Sort of. At least partially. The graph below displays ideological differences between the House and Senate of ideal point estimates for members of each chamber from 1991 to 2017 who voted in the majority and the percentage of bills passed out of those introduced.* In essence, the measure captures chamber differences in the ideologies of those voting in the majority and how bipartisan (scores around .5) or extreme (scores around 0 or 1) the legislation voted on was. The 85th (2017) session wasn’t as ideologically split by chamber as others (like the 78th session in 2003, which precipitated special sessions where Democrats fled the state to break a quorum), but pass ratio was much lower. The downward slope of the linear fit of the data reveal a modest effect of chamber polarization on overall legislative productivity.
These are mass indicators (overall pass rates), so we miss the nuance on specific important legislation (ie, the bathroom bill). Also, the chambers don’t necessarily vote on the same issues. It does give us an average indicator of how chamber differences in the ideology of legislation may dampen overall output. * Data nerd stuff: The ratio of introduced to passed bills is calculated as the total bills passed out of those introduced. Ideal point differences were calculated using the mean ideal point of those who voted in the majority and taking the absolute value difference between the chambers. Ideal point estimations from Shor and McCarty ideological scores, provided generously by Boris Shor. The absolute value of the difference between House and Senate members was then calculated. Note: Check out the great A Political History of the Texas Republic, 1836-1845 by Stanley Siegel for more fascinating detail. With (Very) Little Help to His Friends
Governor Abbott said in remarks at a Texas Public Policy Foundation special session preview that he would be “establishing a list” to call out reluctant legislators who didn’t back him on special session items. Ominously, he added, “No one gets to hide.” One way the Governor with a massive $41 million war chest can help his allies (or punish his enemies) is to lavish their campaign accounts with fund. The evidence, though, doesn’t show generosity to individual candidates but rather an enrichment of the Republican Party more generally. Texas Ethics Commission reports for “Texans For Greg Abbott” (the main fundraising arm of the Abbott campaign) show almost $100,000 in expenditures to various arms of the Republican Party between 2014 and July 2017.* October 2014 (30 Day) Republican Party of Texas, $30,000 July 2015 (July Semi-Annual) Texas Federation of Republican Women PAC, $500 July 2016 (Semi-Annual) Caldwell County Republican Party, $300 Republican Party of Texas, $50,000 January 2017 (Semi-Annual) Associated Republicans of Texas, $7,500 Republican Party of Texas, $11,900 July 2017 (Semi-Annual) Texas Federation of Republican Women PAC, $500 This is not to suggest that the Governor can’t help friends and allies by campaigning with them or lending his name or presence to a fundraiser. He has said recently that he would be “involved” in the 2018 primaries. But these numbers suggest that direct financial campaign assistance is small. * These reports are massive, so .csv files were sorted and searched for “political” or “donation” or “contribution.” Figures do not include hundreds of thousands of dollars given to charities like Family Crisis Center, The Salvation Army, Family Violence Prevention Services and more. |
BR
Brandon Rottinghaus is a Professor of Political Science at the University of Houston Archives
June 2019
Categories |
||||||
Proudly powered by Weebly
 RSS Feed