|
In his first (and only) session as Speaker of the Texas House of Representatives (1911), Sam Rayburn – who would go on to a legendary career as Speaker of the U.S. House – helped create the modern Texas Speaker by using his political position to pass preferred legislation through the emerging committee system. He admitted, however, he “muddled through his first session by God, by desperation, and by ignorance.” * 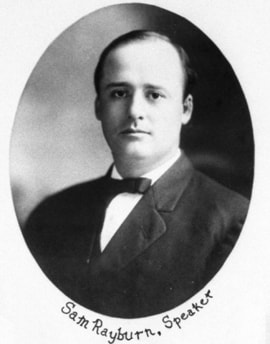 Speaker Dennis Bonnen was elected Speaker of the Texas House 108 years later to lead the 86th legislative session. How does his first year as Speaker compare to other recent Speakers’ first years? The figure below compares the passage rates (total bills referred divided by the bills approved out of committee) of six major committees from the first sessions for the last four new speakers of the Texas House: Pete Laney in the 73rd (1993), Tom Craddick in the 78th (2003), Joe Straus in the 81st (2009), and Dennis Bonnen in the recently passed 86th (2009). 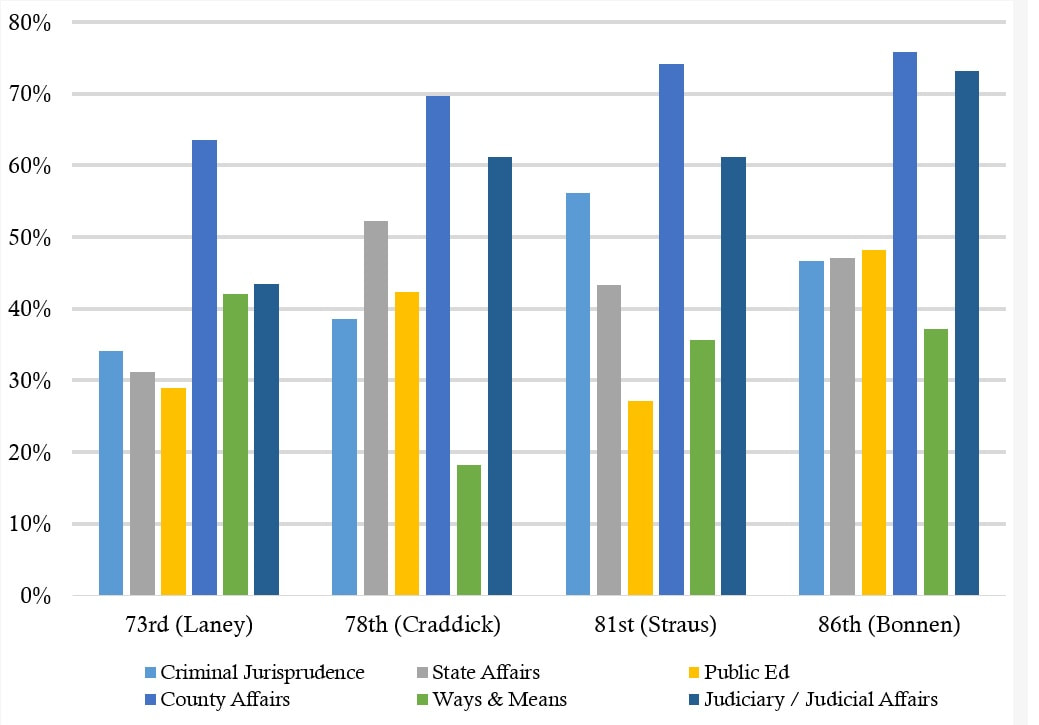 Differences in committee passage rates often due to circumstances outside the control of the Speaker. In some sessions the state was so cash poor that Ways and Means was less busy (the 78th). Other sessions used key committees as superhighways for policy changes – like criminal justice reform and public education reform in the 86th. Gridlock governed other sessions so little legislation got passed. For the 73rd session, Texas Monthly summed it up: “When it was bad, it was awful. There were raucous debates over sodomy and handguns, attacks on sex education, and a rodeo war between Mesquite (honored as the Rodeo Capital of Texas) and Pecos (honored for its Oldest Rodeo in the World).” The workhorse committee State Affairs – a favorite proving ground for leadership’s favored legislation – approved more legislation in the 86th session under Bonnen than the 81st under Straus but not as much as the 78th under Craddick. Both County Affairs and the Judiciary or Judicial Affairs Committee (the name changed over time) have had a freer hand since the 73rd with each passing session. The 86th followed this pattern with more than 70% of legislation referred to these committees pass to second reading.  Bonnen got high marks for keeping his legendary temper (mostly) in check and letting the members run the show. At least as far as committee legislative approval rates are concerned, committee under Speaker Bonnen had approval rates as high or higher on these key committees than most other first term speakers. Pete Laney, who was replaced as Speaker in 2003 after Democrats lost the majority in the House, advised his “job as speaker was to make the job of each member easier by letting them represent their district.”* The evidence suggests that Speaker Bonnen followed this advice.
* Source: Patrick L. Cox and Michael Phillips, The House Will Come to Order (2010) At the Governor’s mansion in Austin, the “Big 3” – Governor Abbott, Lieutenant Governor Patrick, and Speaker Bonnen – declared the 86th Legislature a “Superbowl of sessions.” No MVP would be named, they said, but sessions often produce winners and losers. So, how did the Governor do in this big game as compared to past sessions? The analysis in the table below examines the total legislative proposals passed out of the total legislation proposed in the Governor’s 2019 State of the State Address. 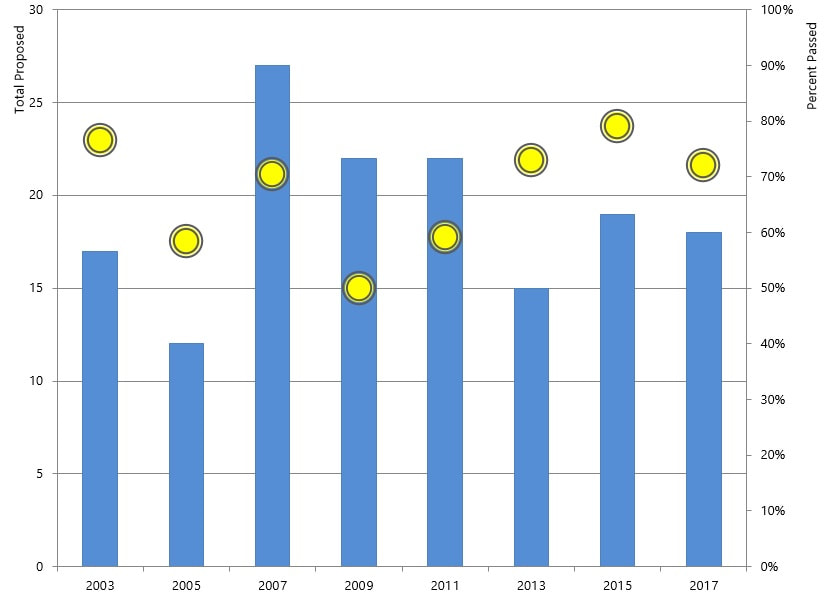 The results are quite good for Governor Abbott – his success rate was 84%, higher than his previous three sessions (2013-2017). This success rate was also higher than Governor Perry’s last few sessions. The Governor was batting 100% on his emergency items: teacher pay, school finance, property tax caps, rape kit backlogs. Most of these priority items were (more or less) agreed to before the session started but the Governor gets some credit for working the process to get them into law. Most of his other items (like new anti-gang centers, funds to combat human trafficking, and more funding for veterans) also passed.  What didn’t pass were smaller agenda items. One request was for an increase in border security funds – the state ponied up their usual spending (about $800 million) but Governor Abbott’s last minute request for an extra $100 million was quickly rejected. Aggies and Longhorns anxious for a gridiron matchup to renew their football rivalry were as disappointed as the Governor that legislation encouraging the annual game didn’t get past the line of scrimmage.
Several large Texas counties (Harris, Bexar, Dallas) are switching to county-wide polling locations citing lower costs and voter convenience. But, do vote centers boost voter turnout? In this comprehensive study we examine the transition to vote centers in Texas across the several election types. (The article is forthcoming at Research & Politics.) BACKGROUND: In 2005, the Texas Legislature approved a program (HB 758) for county-level decision making to move from precinct level voting to “vote centers” for the November 2006 elections. Lubbock County was the first participant the program in 2006, replacing the county’s 69 precincts with 35 vote centers (but kept 8 precincts in rural areas). By 2018, 52 Texas counties used vote centers to conduct constitutional amendment, midterm, or presidential elections. **** TECHNICAL STUFF: To test the impact of vote centers on turnout under distinct elections, we fit a difference-in-difference (DD) fixed effect model with clustered standard errors at the county level. The DD estimator allows us to compare counties before and after the implementation of vote centers by estimating the difference between the observed mean turnout for counties with vote centers and counties with no vote centers before and after a particular implementation year. **** Do vote centers boost turnout? Using a natural experiment in Texas we find vote centers have a small positive impact on constitutional election turnout (about 4%) but no significant effect on turnout in midterm or presidential elections. PAPER HERE:
What about counties using the process for longer – do voters adapt gradually? The cumulative impact of vote centers over a longer period of time does have a small positive effect on turnout in constitutional elections (about 4%). There aren’t any long term positive effects detected for midterm or presidential elections. (this could partly be because adoptions by several counties is a fairly recent trend so the long term effects are not set yet).
TAKEAWAY : The results from this article show that lower turnout elections (constitutional) benefit from vote centers more than larger turnout elections (midterm/gubernatorial, presidential). The long term effects are slowly emerging. These results suggest a more cautious assessment is needed when considering the use and impact of vote centers. |
BR
Brandon Rottinghaus is a Professor of Political Science at the University of Houston Archives
June 2019
Categories |
||
 RSS Feed